
PSY140 (Being a Psychologist) is a 40 credit core module taken on all undergraduate Psychology routes. It covers research methods and statistics, academic development and study skills, and career development. It is assessed by three research reports and a portfolio which is hosted on the University’s ePortfolio, Mahara, and consists of tasks which vary slightly from year to year which assess research and academic skills together with reflection on academic development.
We had an existing optional formative assessment early in semester one – based on a literature search activity in a workshop, students were asked to choose from a list of topics and write a 500 word summary using about three primary sources of what they found out. This was then marked by the students’ Personal Academic Tutor (PAT) with verbal feedback during the first face-to-face PAT meeting in late October. This topic then becomes the basis for one page in the portfolio (a research design activity worksheet and qualitative mini thematic analysis) which we kickstarted here by getting them to upload this formative assessment and its feedback as the introduction to this page.
To use Studiosity we used this same process. We extended the assessment to 750 words (this was in response to feedback from previous years) and produced two deadlines – one for submission to Studiosity and one a week later for submission of the edited and improved version to Canvas. The topics were introduced in the library / literature searching workshop in week 2 of the module and we suggested using 3+ sources. The topics were all related to issues in the psychology of studying (e.g. procrastination, perfectionism, academic integrity) and students chose their own.
We repeatedly reminded them of the assessment and encouraged uptake. There was some disturbance to this process as a cyber-attack on the University coincided with the deadline we had originally given for submission to Studiosity, but we extended this and were flexible to allow as many as possible to take part.
Outcome and relation to success on the module
For this analysis I tabulated the number of students who engaged with this formative assessment and their “fate” on PSY140 – did they pass the module at first attempt? Numbers are shown in table 1.
Table 1. Contingency table showing association between engagement with formative assessment and passing PSY140 at first attempt [figures are numbers of students (expected number)]
|
|
Did not Pass | Passed | Totals |
|
Engaged with F.A. |
26 (43.2) | 76 (58.8) | 102 |
| Did not Engage | 32 (13.8) | 3 (20.2) |
35 |
| Totals | 58 | 79 |
137 |
There is a significant and strong association between doing the formative assessment and passing at first attempt χ2(1) = 46.41, p<.001 (Fischer’s exact) as shown in figure 1 below. The risk ratio (pass rate ratio difference) is 8.69 [95% C.I. 2.92 – 25.80] with an odds ratio of 31.18 [95% C.I. 8.80 – 110.41] – so the odds of passing at first attempt if engaging are 31.18 x higher than those not engaging. In terms of effect size this is a massive difference but NB this may purely be an effect of those who chose to engage.
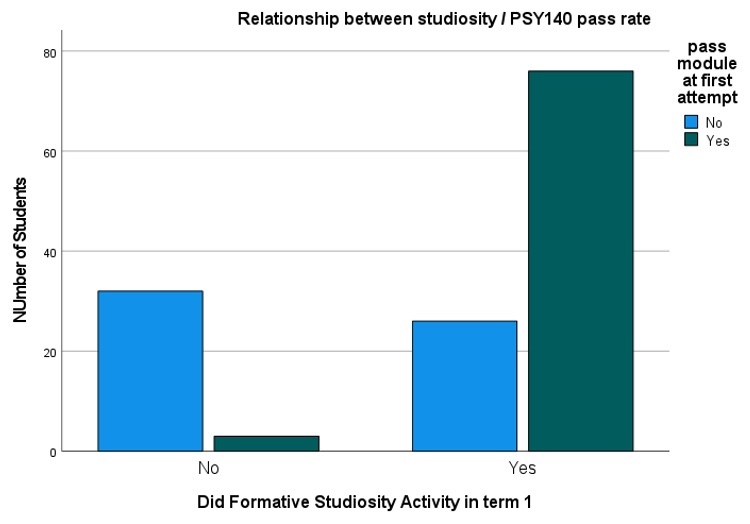
Note: It is VERY important to note that one cannot tell if this relationship is causal – it may simply be that the students who chose to engage were more likely to pass in any case and there is likely to be a big element of this. However, it is unlikely that we are able to ascribe all of the relationship to this factor and it may be that what we are seeing here is some element of a two-way relationship with engagement causing some of the outcome. A much more formal trial would be needed to elucidate this relationship in detail. It is very certainly however a strong warning signal that non engagement has a very poor outcome – 91.5% of those who did not do the Studiosity assignment did not pass the module.
Differences in marks
Overall pass marks on the module were higher in those who used the formative assessment than those who didn’t (60.6 (17.9) n = 76 v 56.1 (10.0) n =3) but unsurprisingly given the small number here this is not significantly different (t(2.05) = 233, p = .35). The effect size estimate of d = .44 [-0.72 – 1.59] is reasonably large. Because of the unequal allocation sizes here a very large sample would be needed to find a significant result of this size with 90% power – assuming an allocation ratio of 15:1 [i.e. one student in 15 did not do the formative assessment as here] one would require a total sample size of 930 to reach an alpha of .05 which is unfeasible. Again, any difference may be being driven by student choice.
Examining the whole cohort (including those who failed at first attempt) the mean marks for each assessment are shown in table 2. Comparisons were made using Welch’s t-test (unequal variances and group sizes). Formative assessment took place prior to practical one in semester one and also fed into one page of the portfolio which assessed the entire year’s work and was submitted at end of semester two. It is interesting to note that there is no significant difference in marks by practical three (late in semester two) though of course it is impossible to make any causative evaluation at this point. Number of students submitting each assignment varies leading to differing group sizes.
Table 2. Mean (SD) mark for each assignment and total module for students who did / did not engage with the formative assignment
|
|
Did formative | Did not engage | p | Effect size d [95% C.I.] |
|
Practical One |
56.2 (15.9) n= 91 | 42.4 (19.2) n = 17 | .006 | 0.83 [.31 – 1.37] |
|
Practical Two |
55.7 (13.30 n = 87 | 44.1 (20.2) n=11 | .045 | 0.81 [.18 – 1.44] |
| Practical Three | 54.7 (13.1) n = 81 | 55.2 (17.2) n = 6 | .476 |
.03 [-.79 – .86] |
| Portfolio | 63.4 (15.4) n = 82 | 43.1 (24.4) n = 82 | .026 |
1.33 [ .48 – 1.96] |
| Module | 48.6 (23.3) n = 102 | 13.1 (18.9) n = 34 | <.001 |
1.58 [ 1.14 – 2.00] |
It is also possible to look at the marks of the previous cohort and (given many caveats about other cohort differences and the effect of lockdown) compare the module marks in those who did the formative assessment last year (no Studiosity support) with those who did it last year. Here there are no significant differences and all effect sizes are small. For an overall module mark difference of this magnitude to be significant at 90% power would require a total sample size of 1458 students.
Table 2. Mean (SD) mark for each assignment and total module for students who did (S+) / did not (S-) have Studiosity support with the formative assignment
|
|
Current Year (S+) | Previous year (S-) | p | Effect size d [95% C.I.] |
|
Practical One |
56.2 (15.9) n= 91 | 54.3 (16.6) n = 84 | .22 | 0.12 [ -.18 – .41] |
|
Practical Two |
55.7 (13.30 n = 87 | 54.3 (15.0) n=84 | .27 | 0.09 [-.21 – .09] |
| Practical Three | 54.7 (13.1) n = 81 | 52.9 (16.1) n = 86 | .21 |
0.12 [-.18 – .42] |
| Portfolio | 63.4 (15.4) n = 82 | 61.5 (16.9) n = 80 | .23 |
0.12 [-.19 – .43] |
| Module | 48.6 (23.3) n = 102 | 44.4 (25.3) n = 106 | .10 |
0.17 [ -.10 – .44] |
Conclusions
It is hard to draw firm conclusions from the numerical analysis however the association of passing or not at first attempt with engagement with the formative assessment is clear and this non engagement should be taken as a major early warning sign. In addition, the differences in marks across the module (and the way these differences diminish as the year progresses) are suggestive that engaging in the formative assessment is having a positive effect. The very rough comparison with previous years – although all the differences appear at first glance to be in the “right direction” – really shows no significant differences but here year-on-year cohort differences probably have a huge effect as well as the change between a COVID lockdown year and a less lockdowned year.
Jon Rees is a Senior Lecturer in Psychology at the University of Sunderland.
1 thought on “How Studiosity Was Embedded Into A Core Psychology Module”